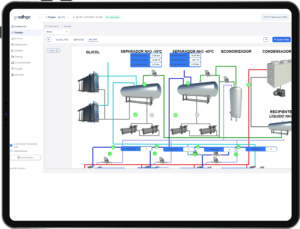
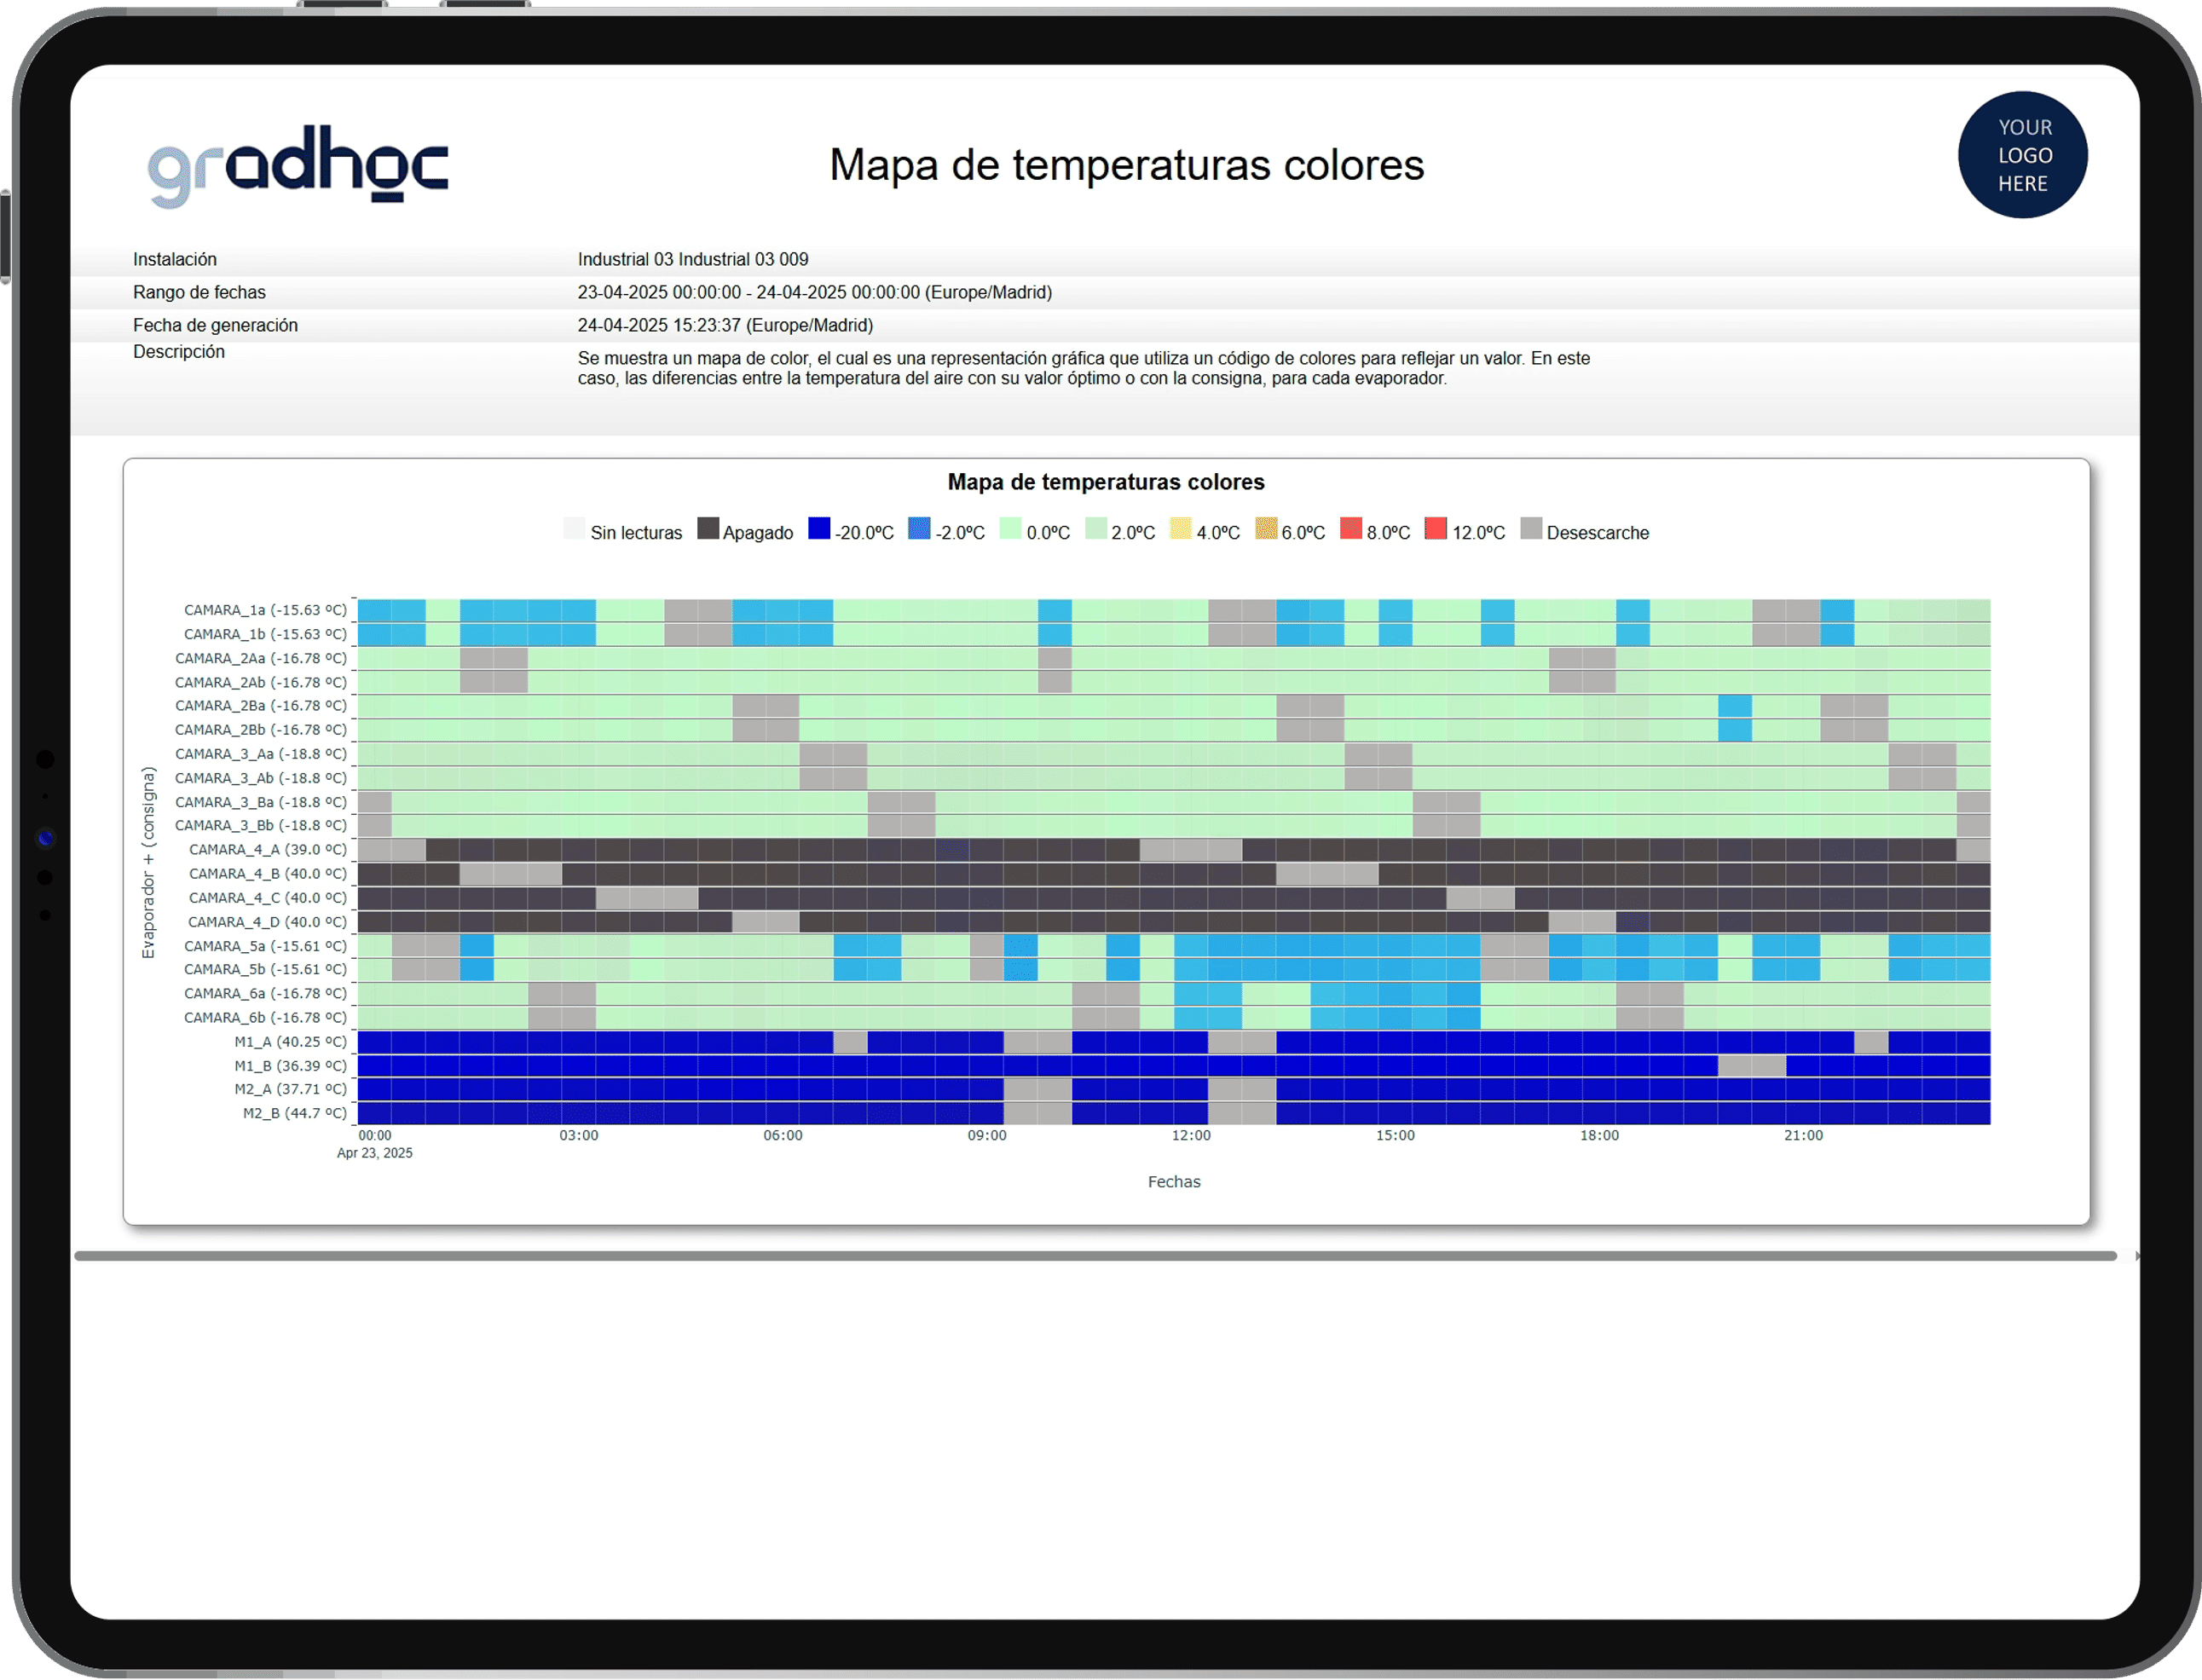
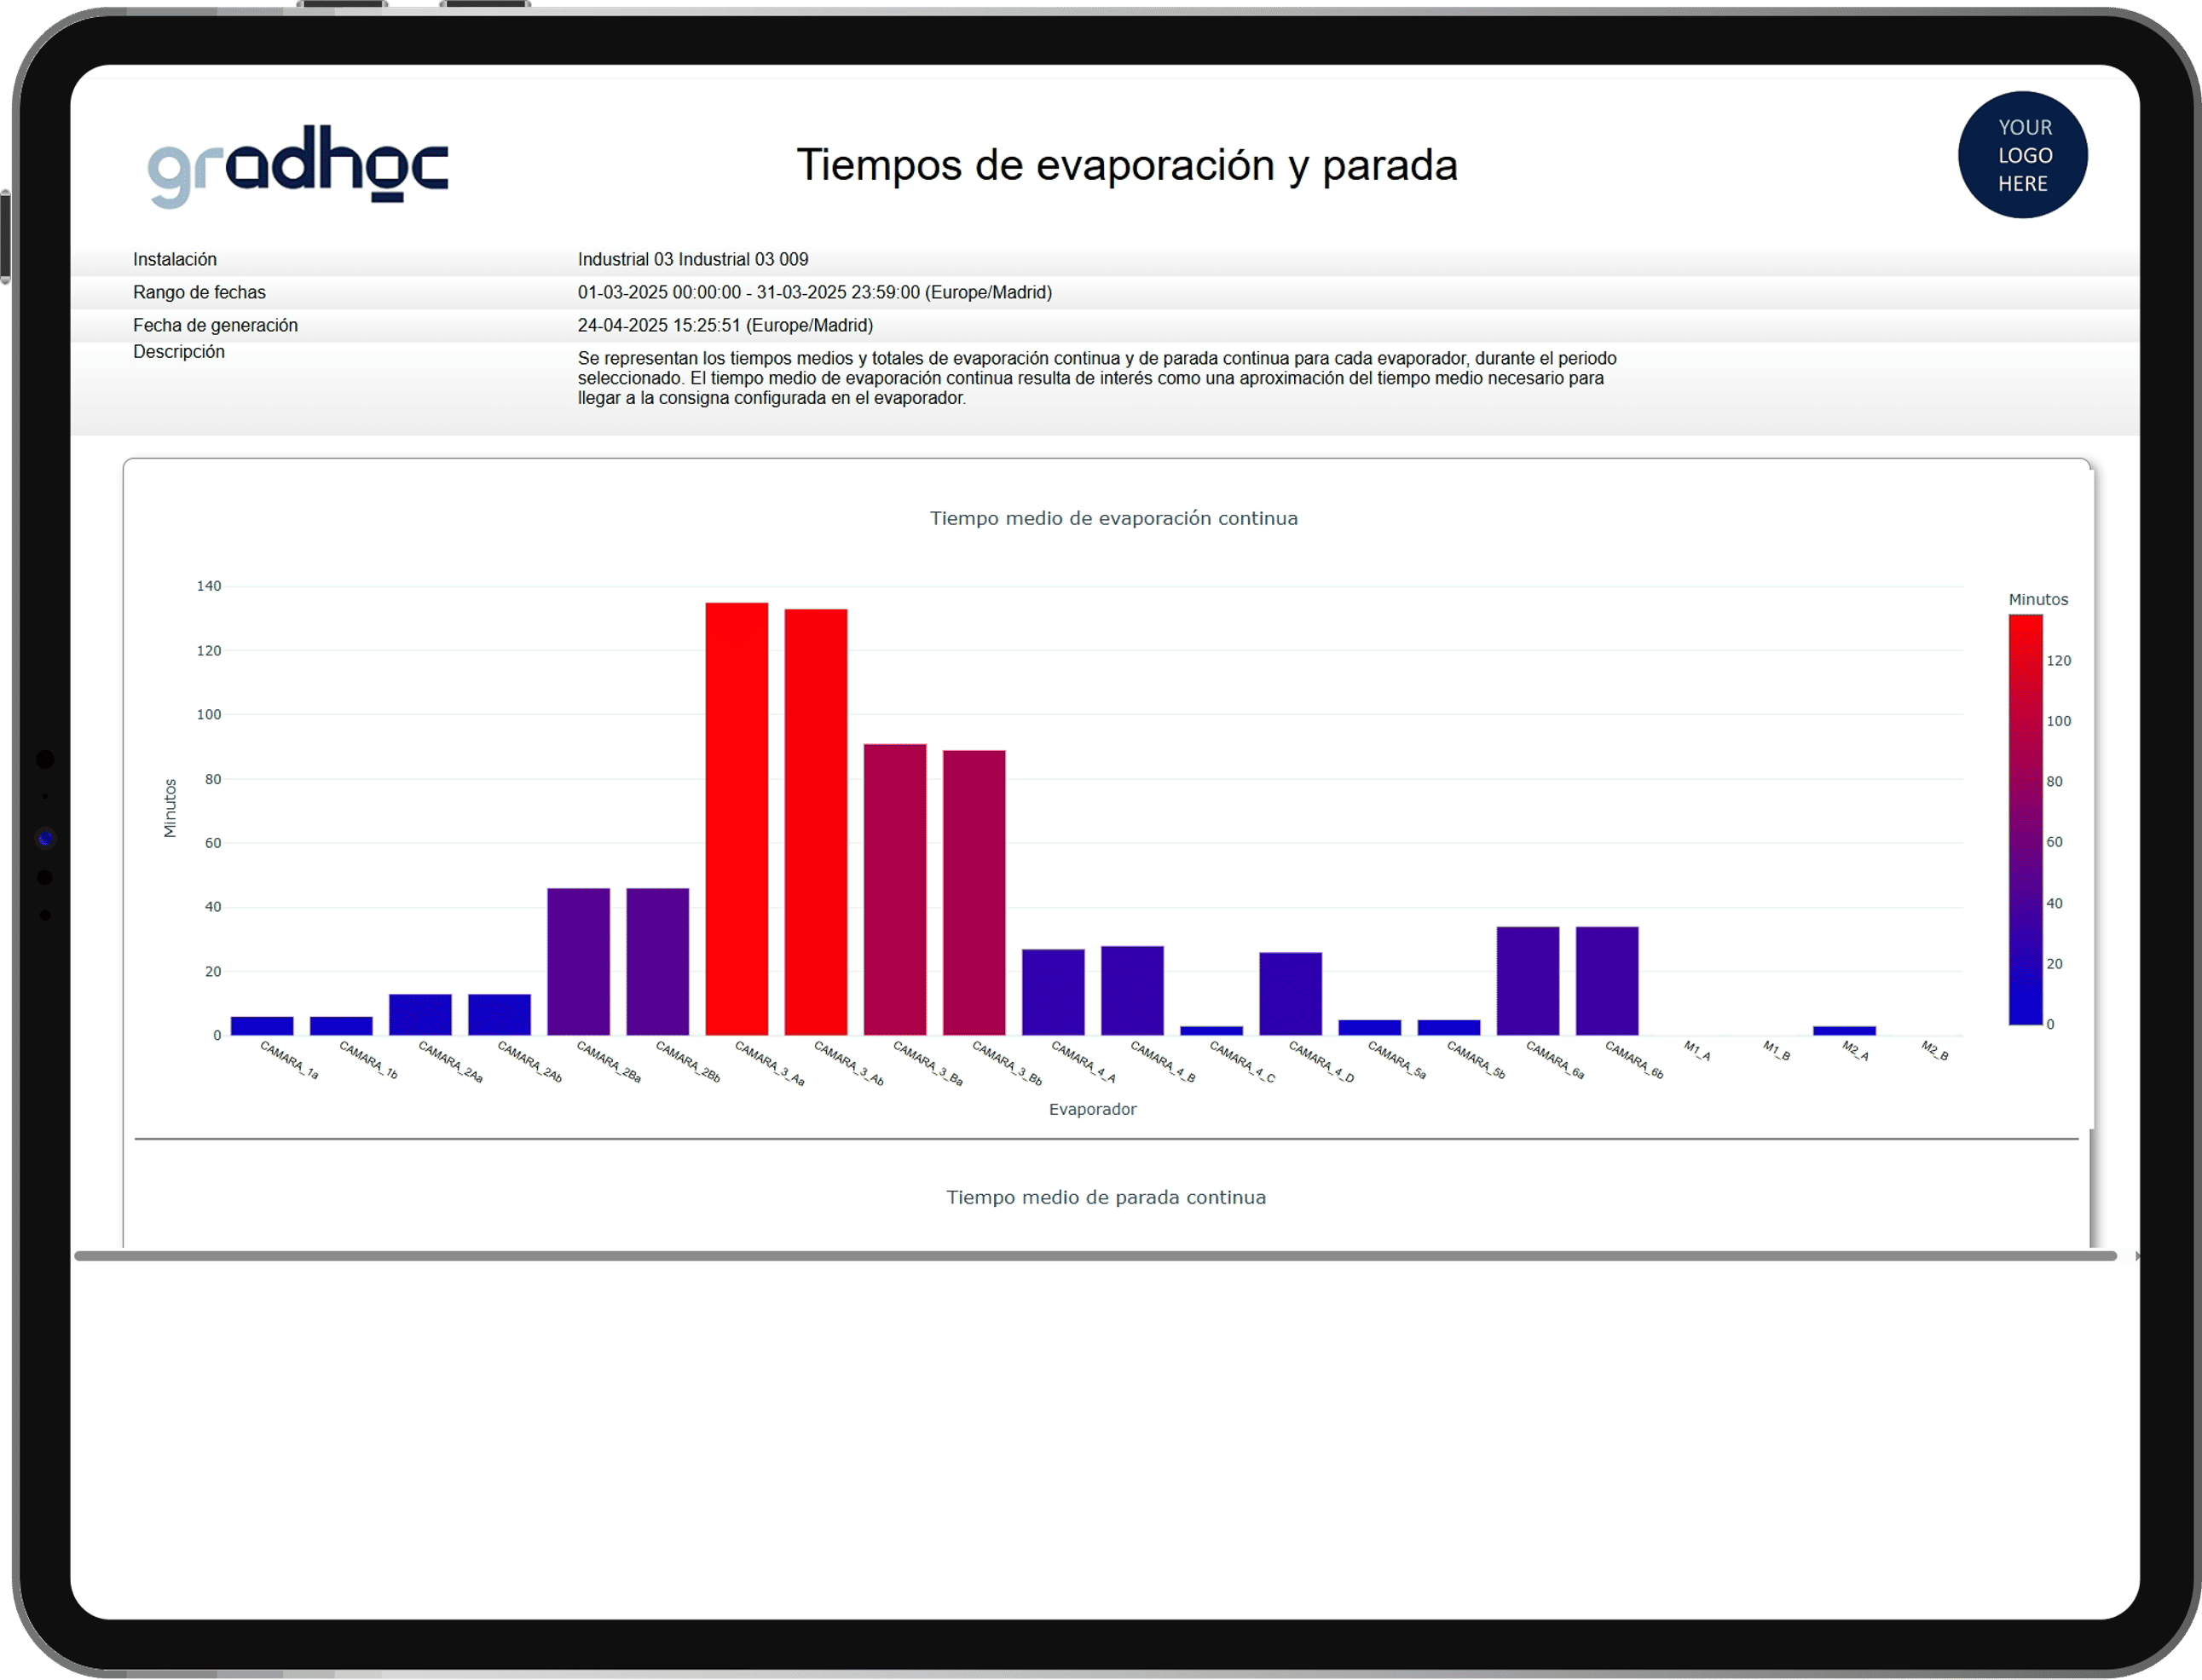
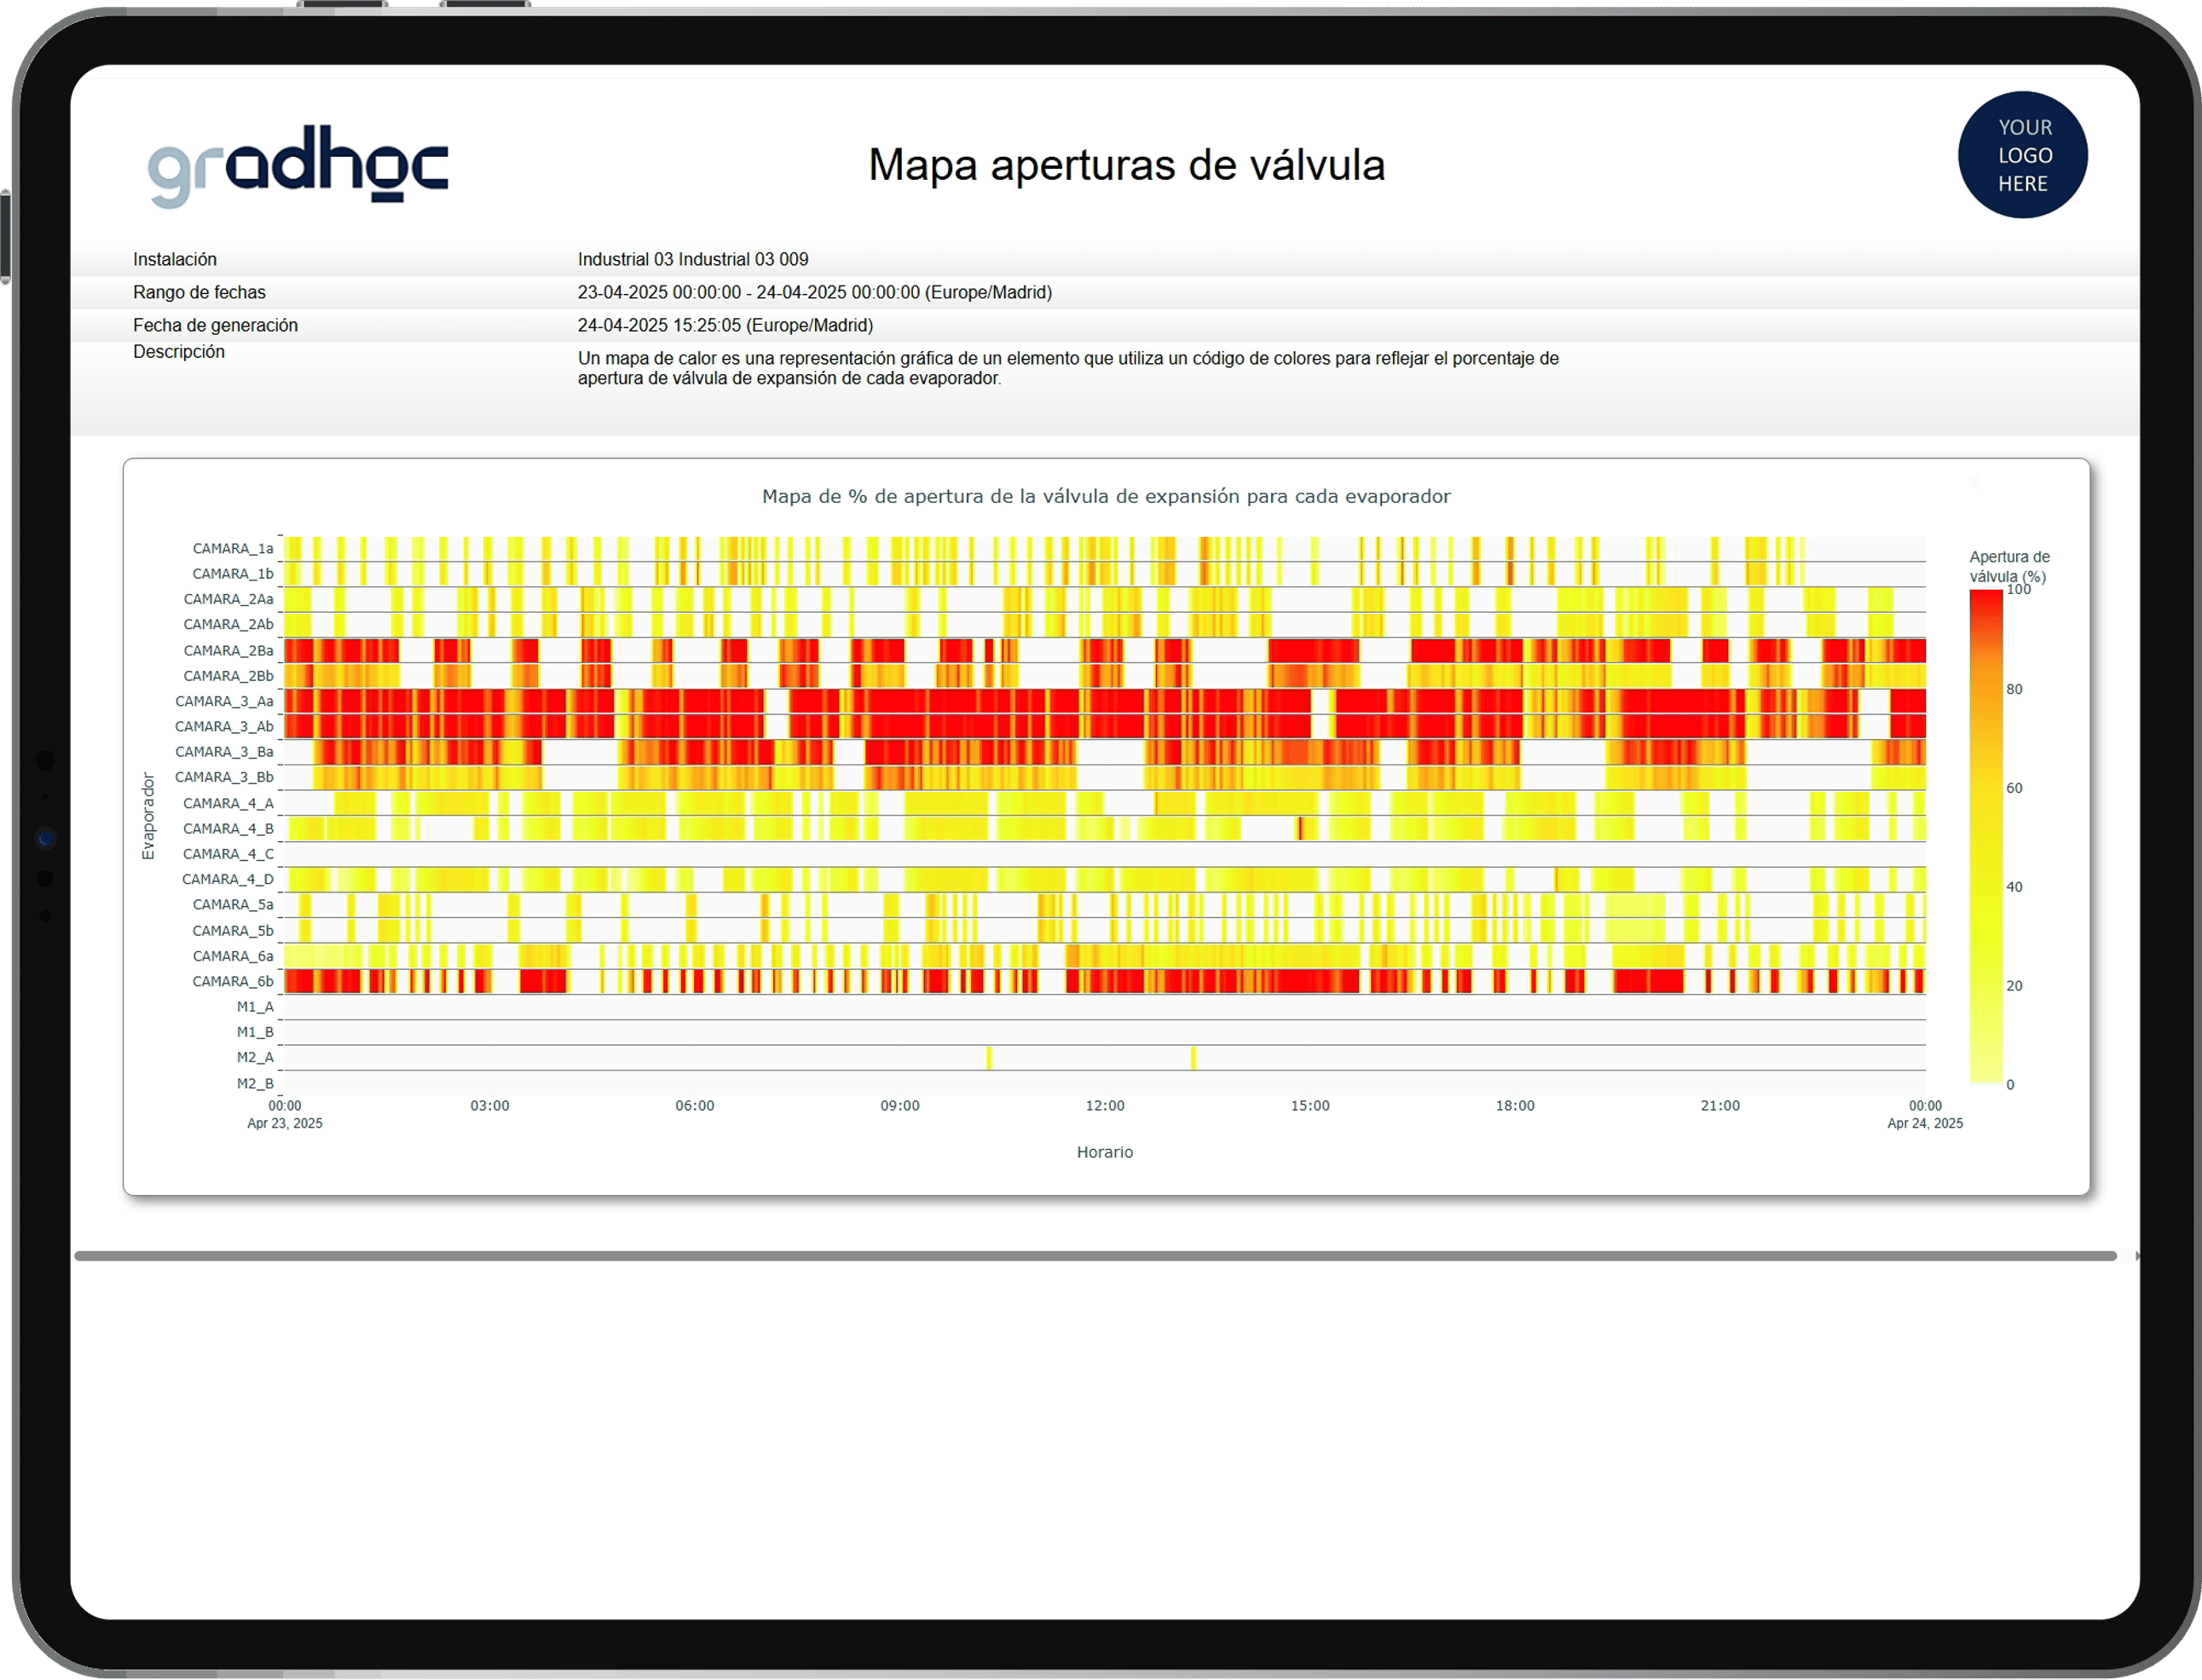
The platform includes a data visualization component, featuring charts related to the monitoring of variables. It is also capable of representing additional results through the application of statistical models, offering the following functionalities:
Generation of predefined and ad hoc reports, both in real time and with programmable automatic sending.
Customize dashboards with KPIs to streamline information and support decision-making. Compare multiple facilities and analyze profitability by production line.
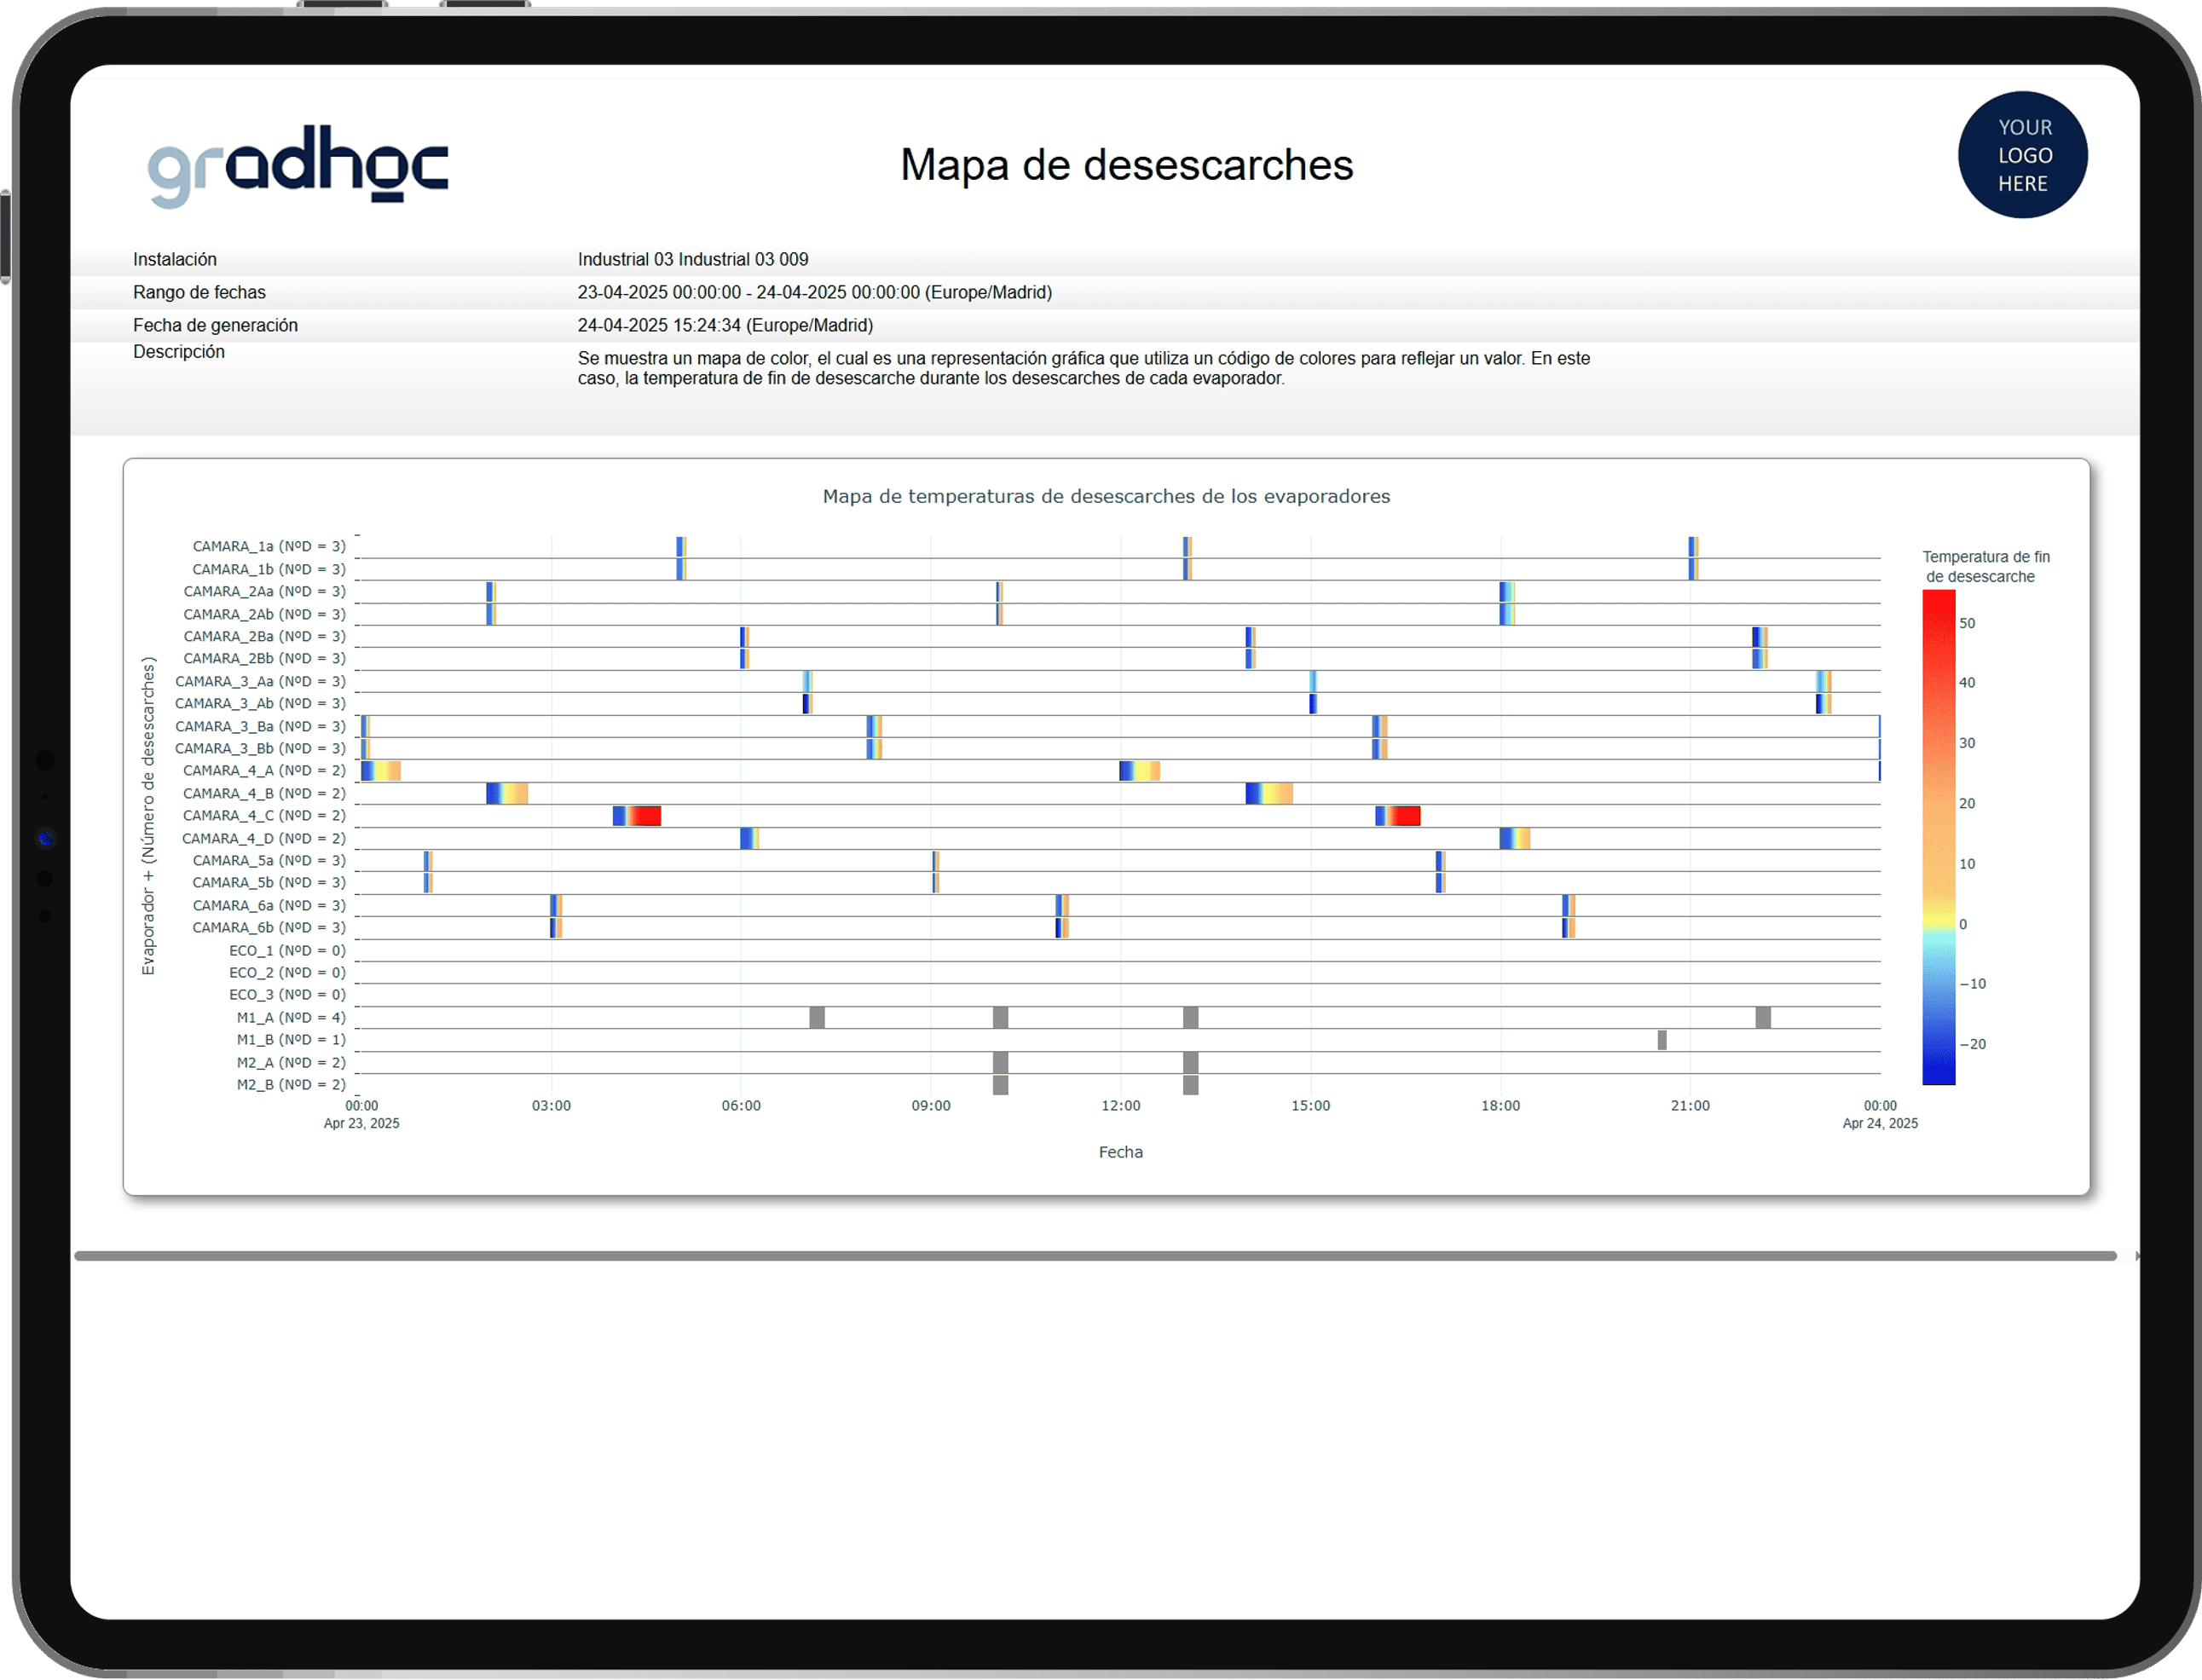
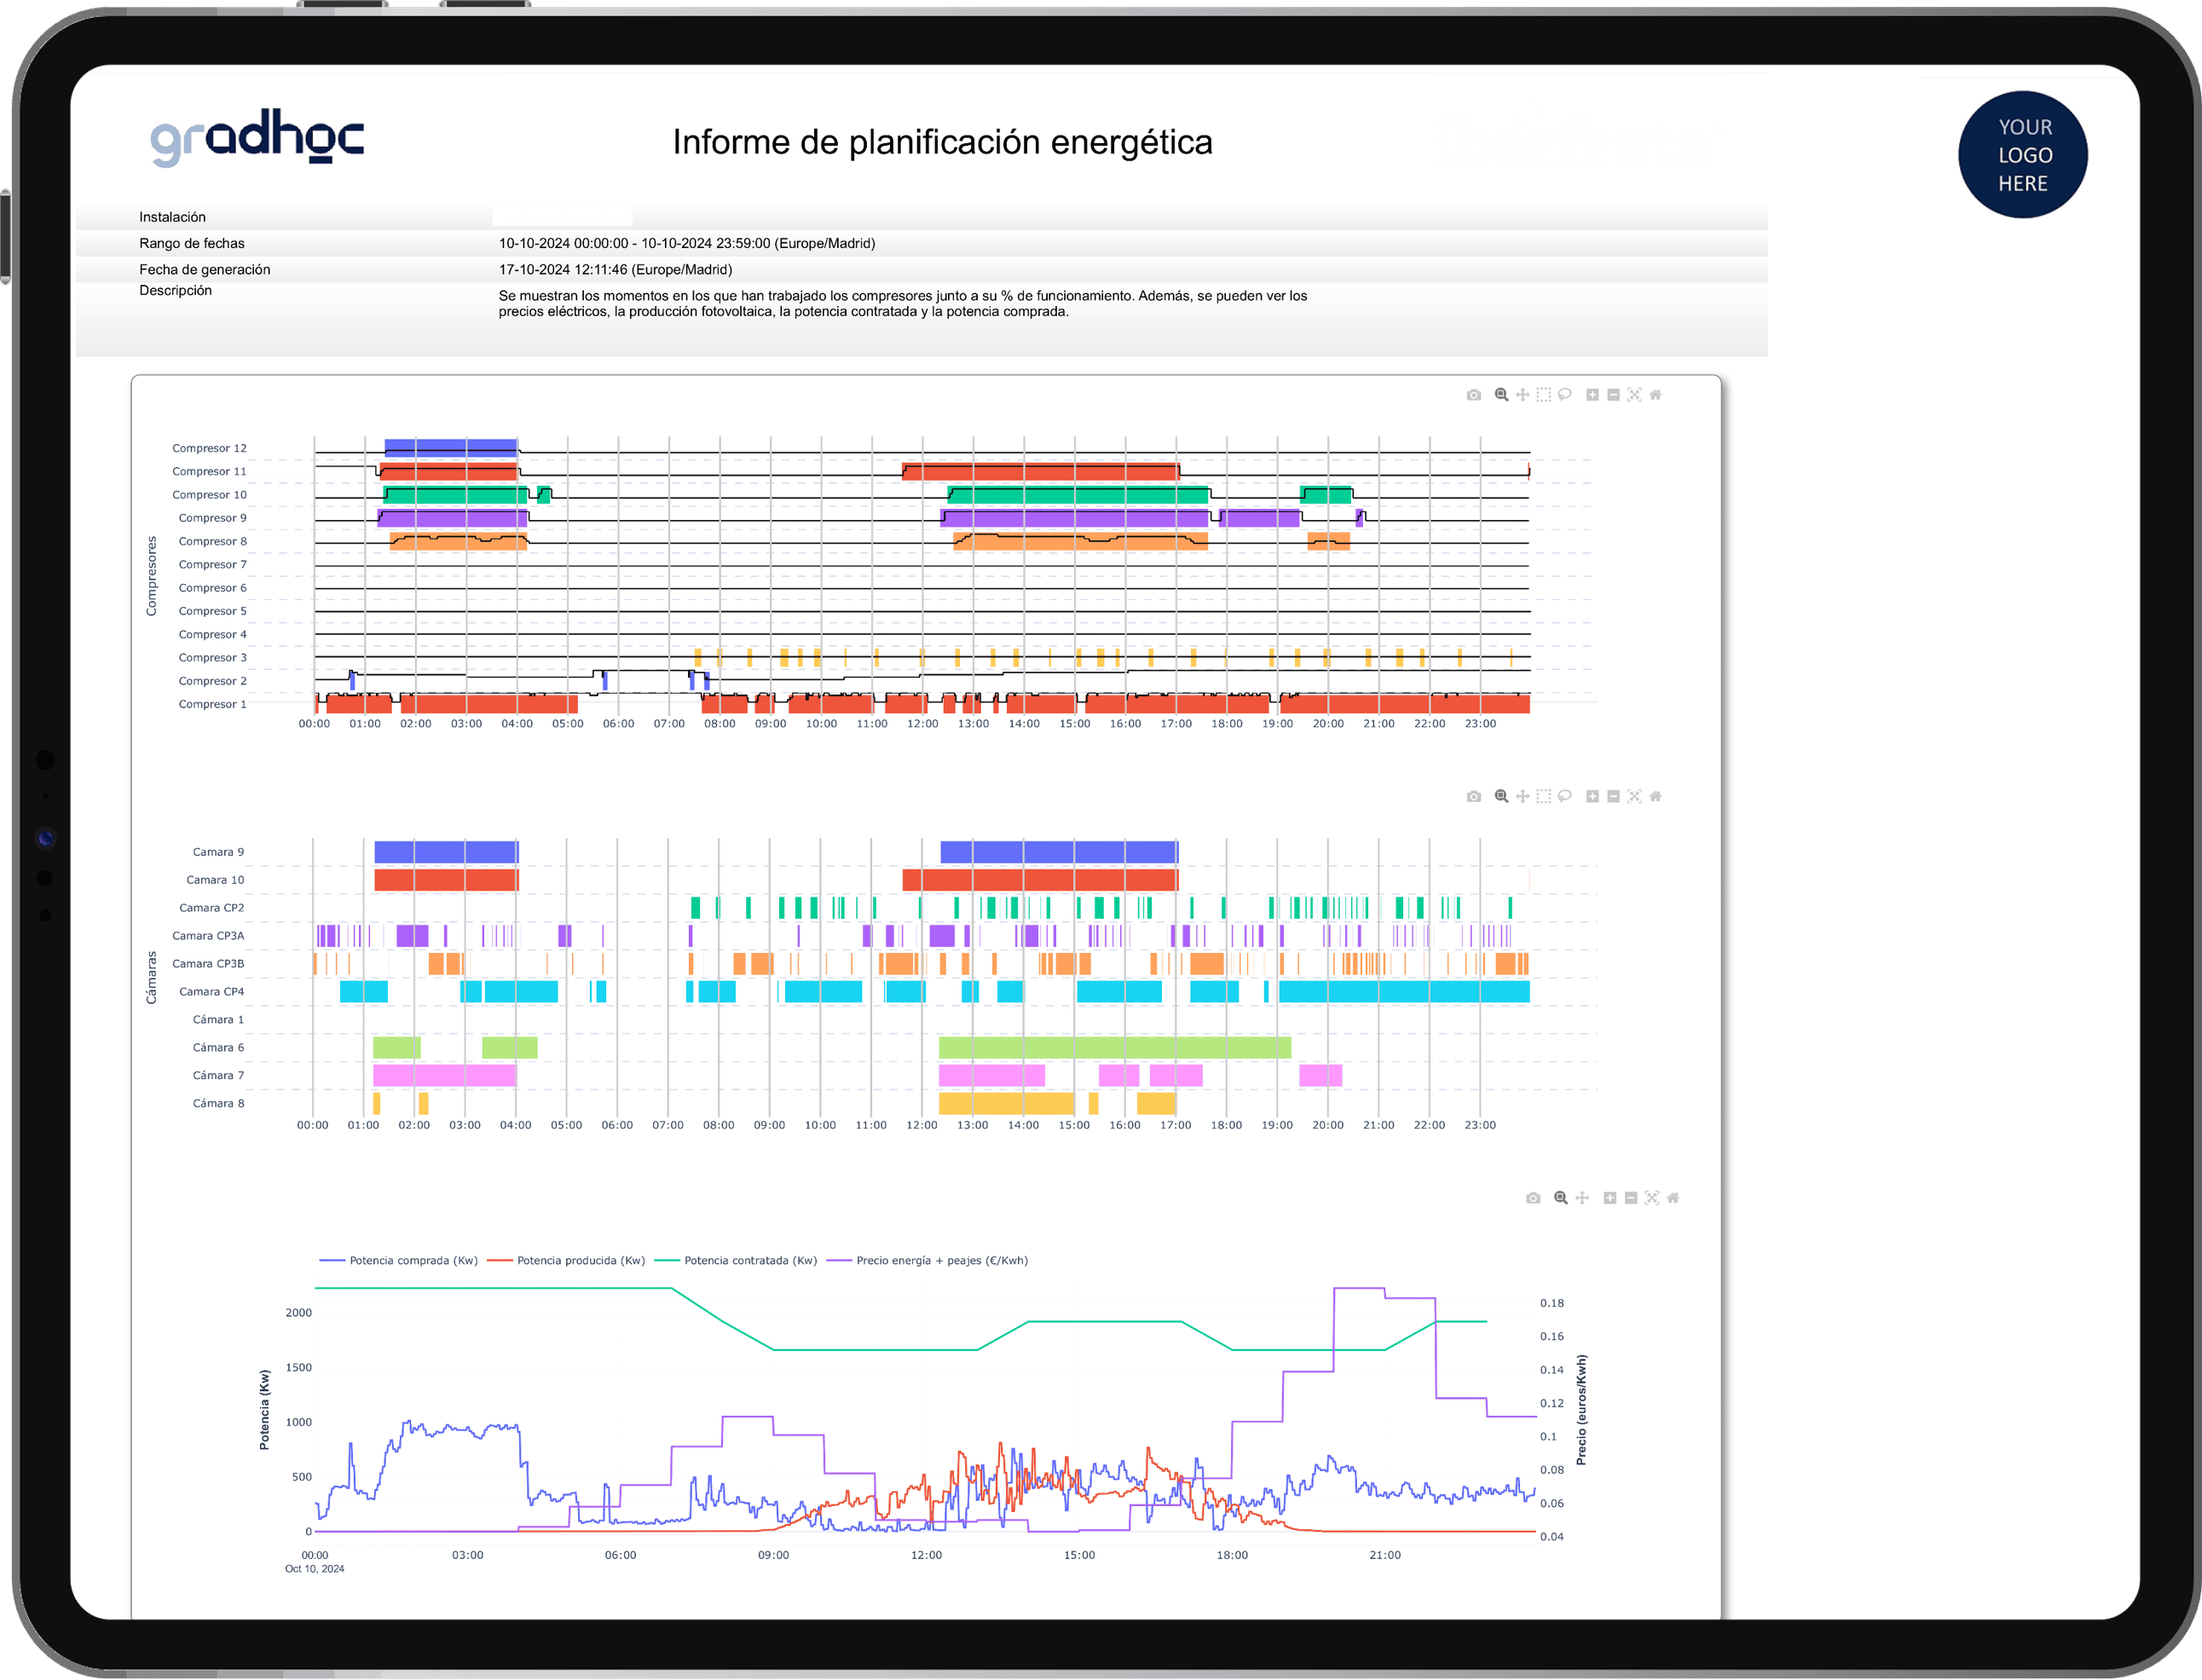
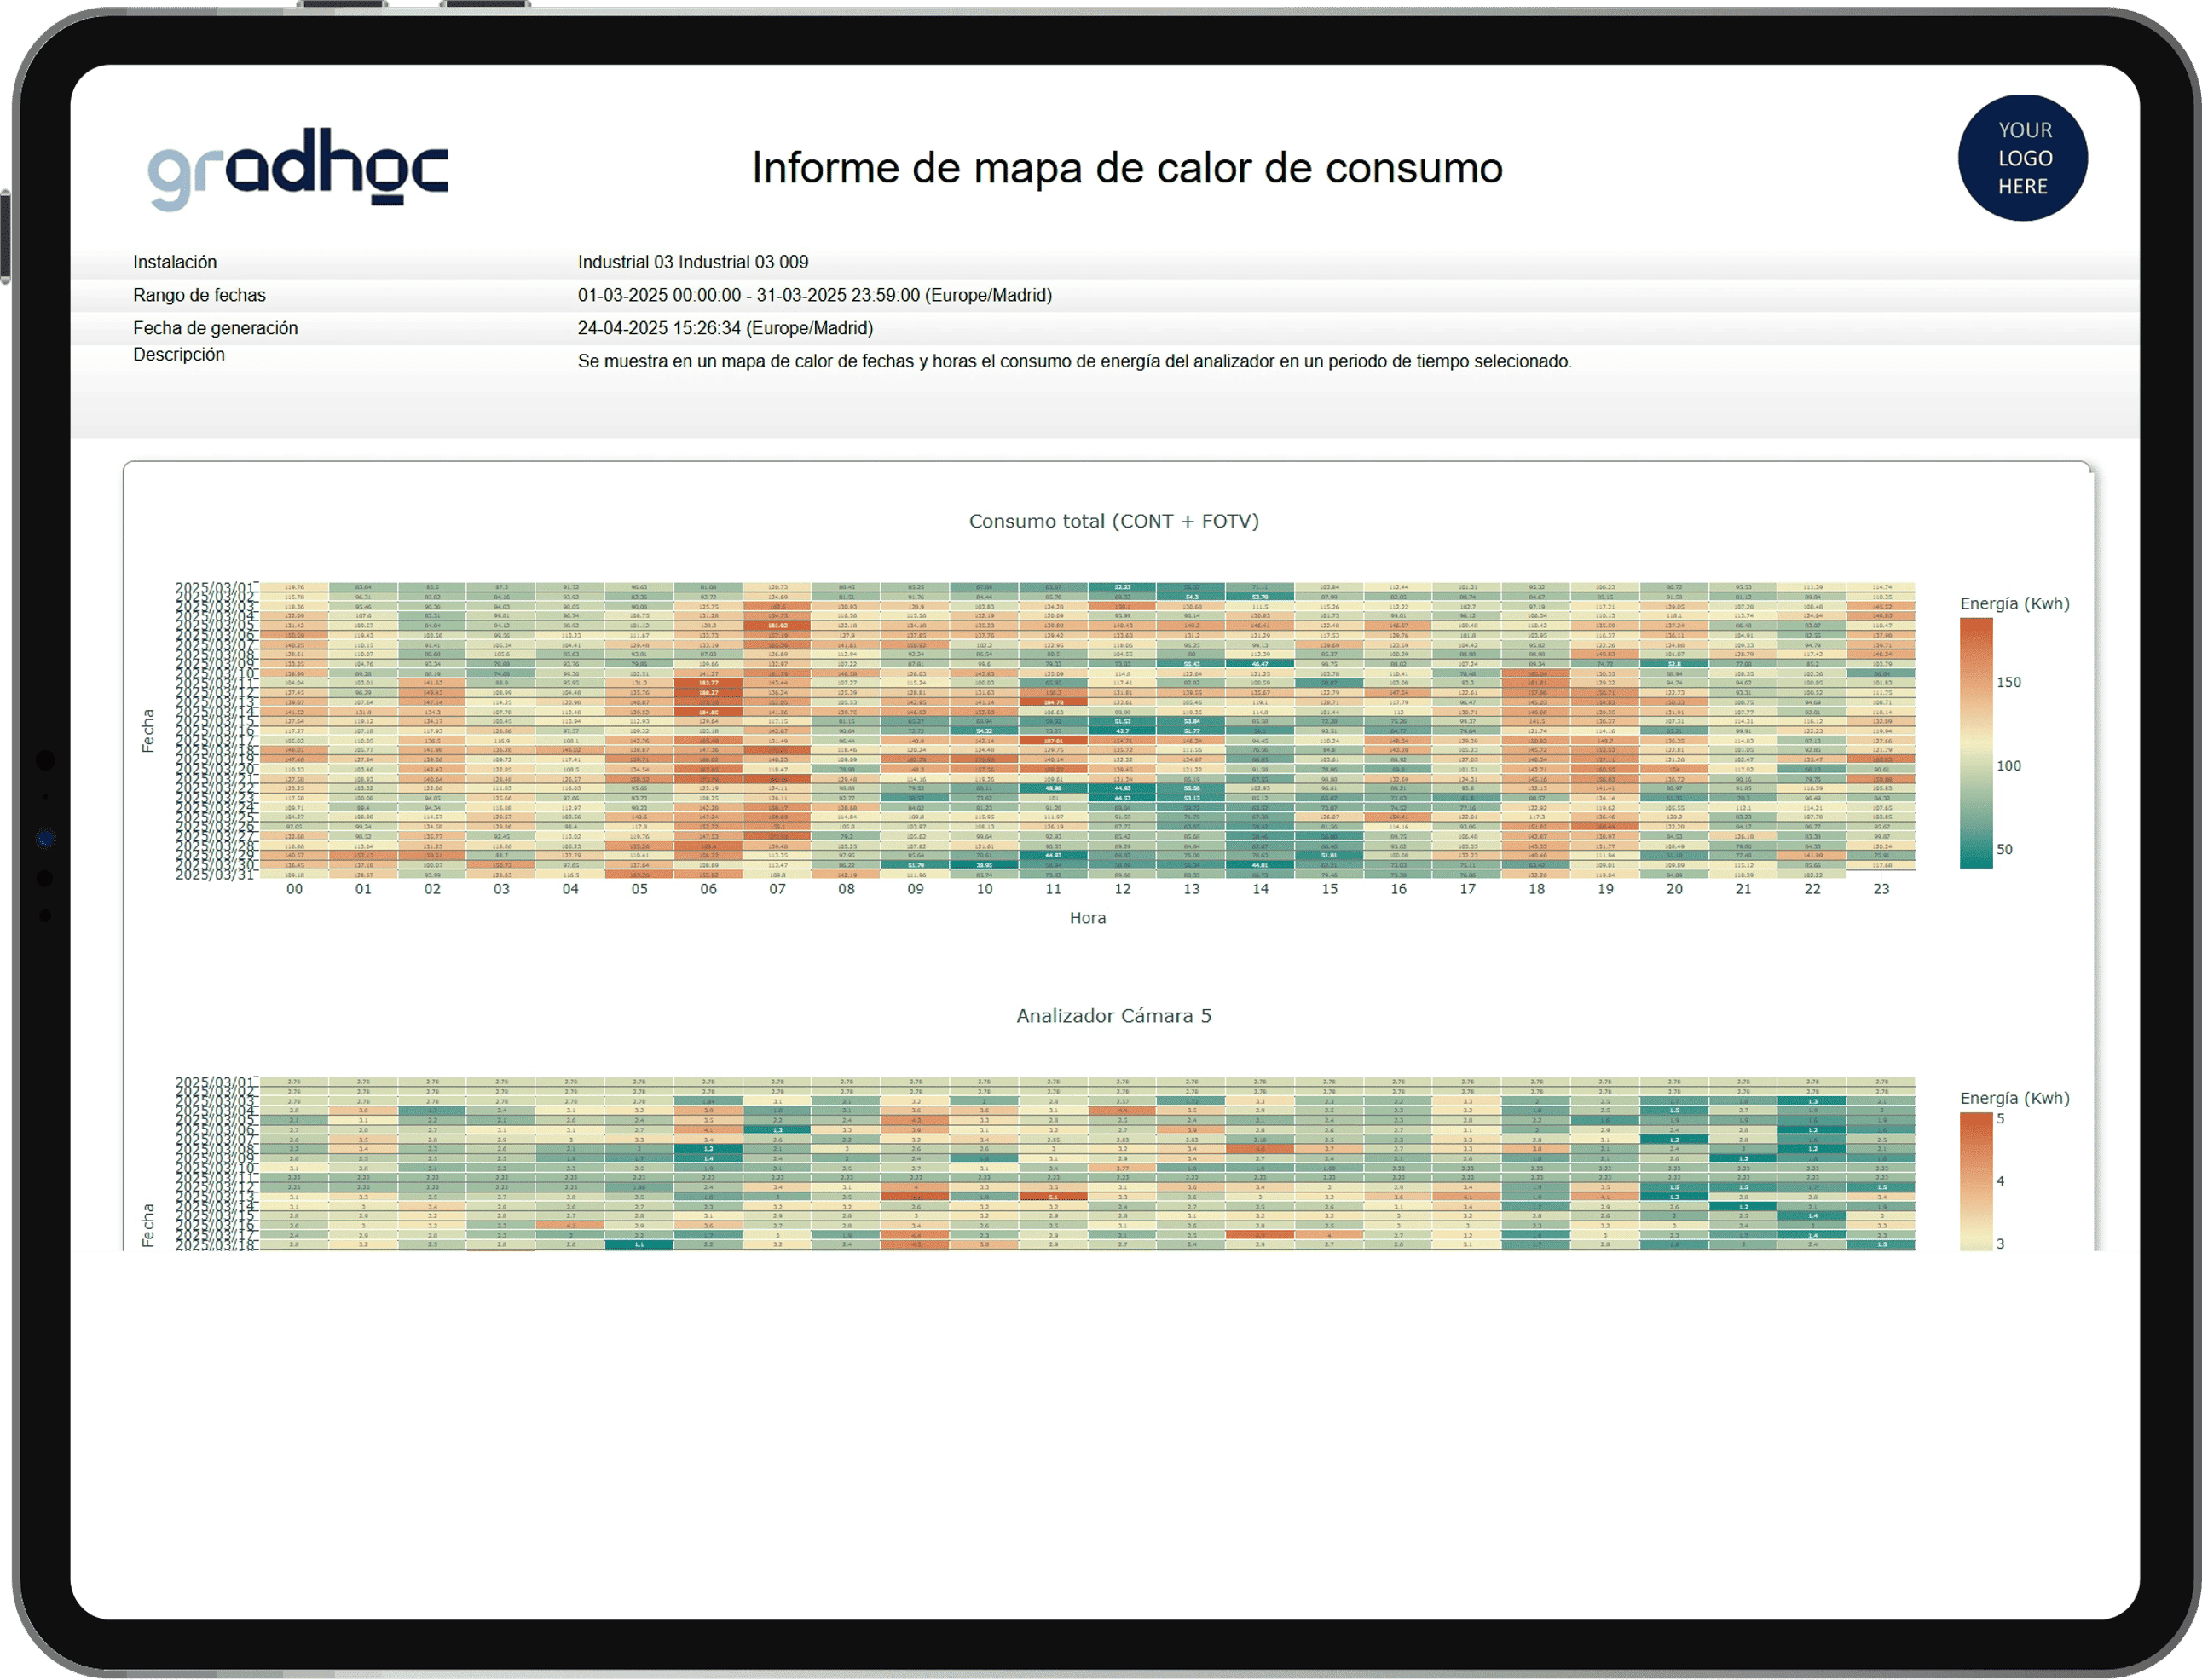
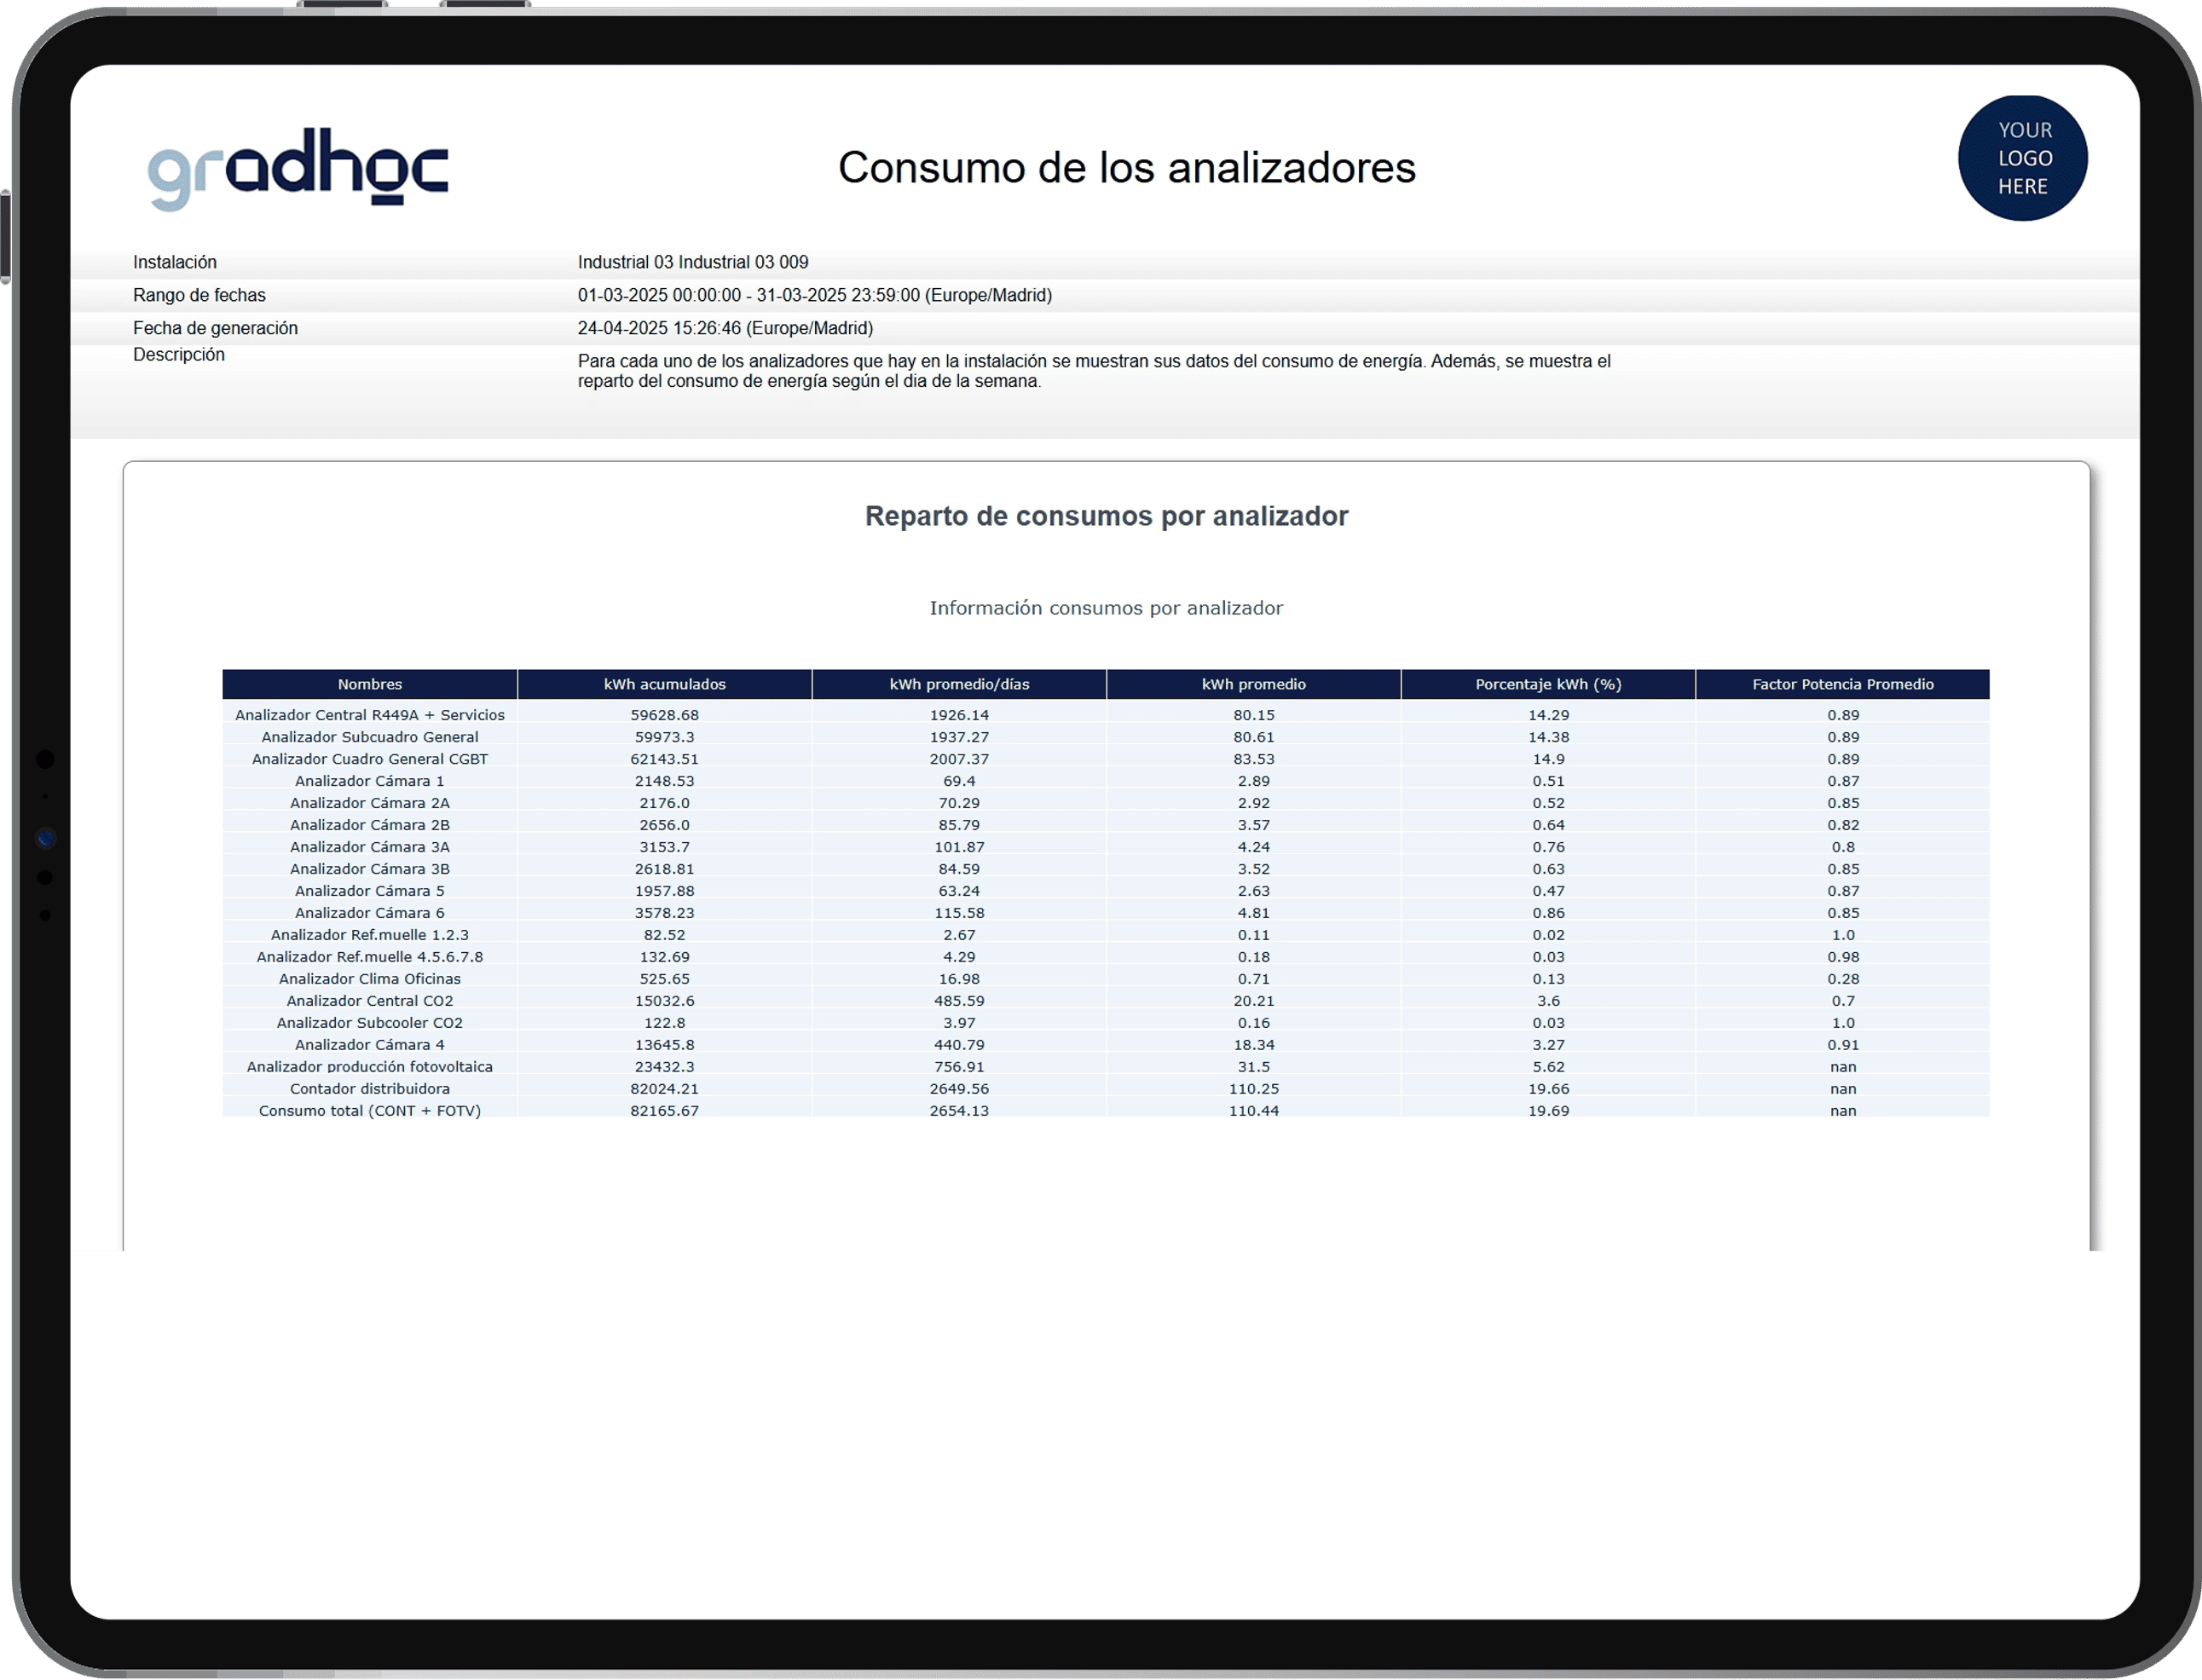
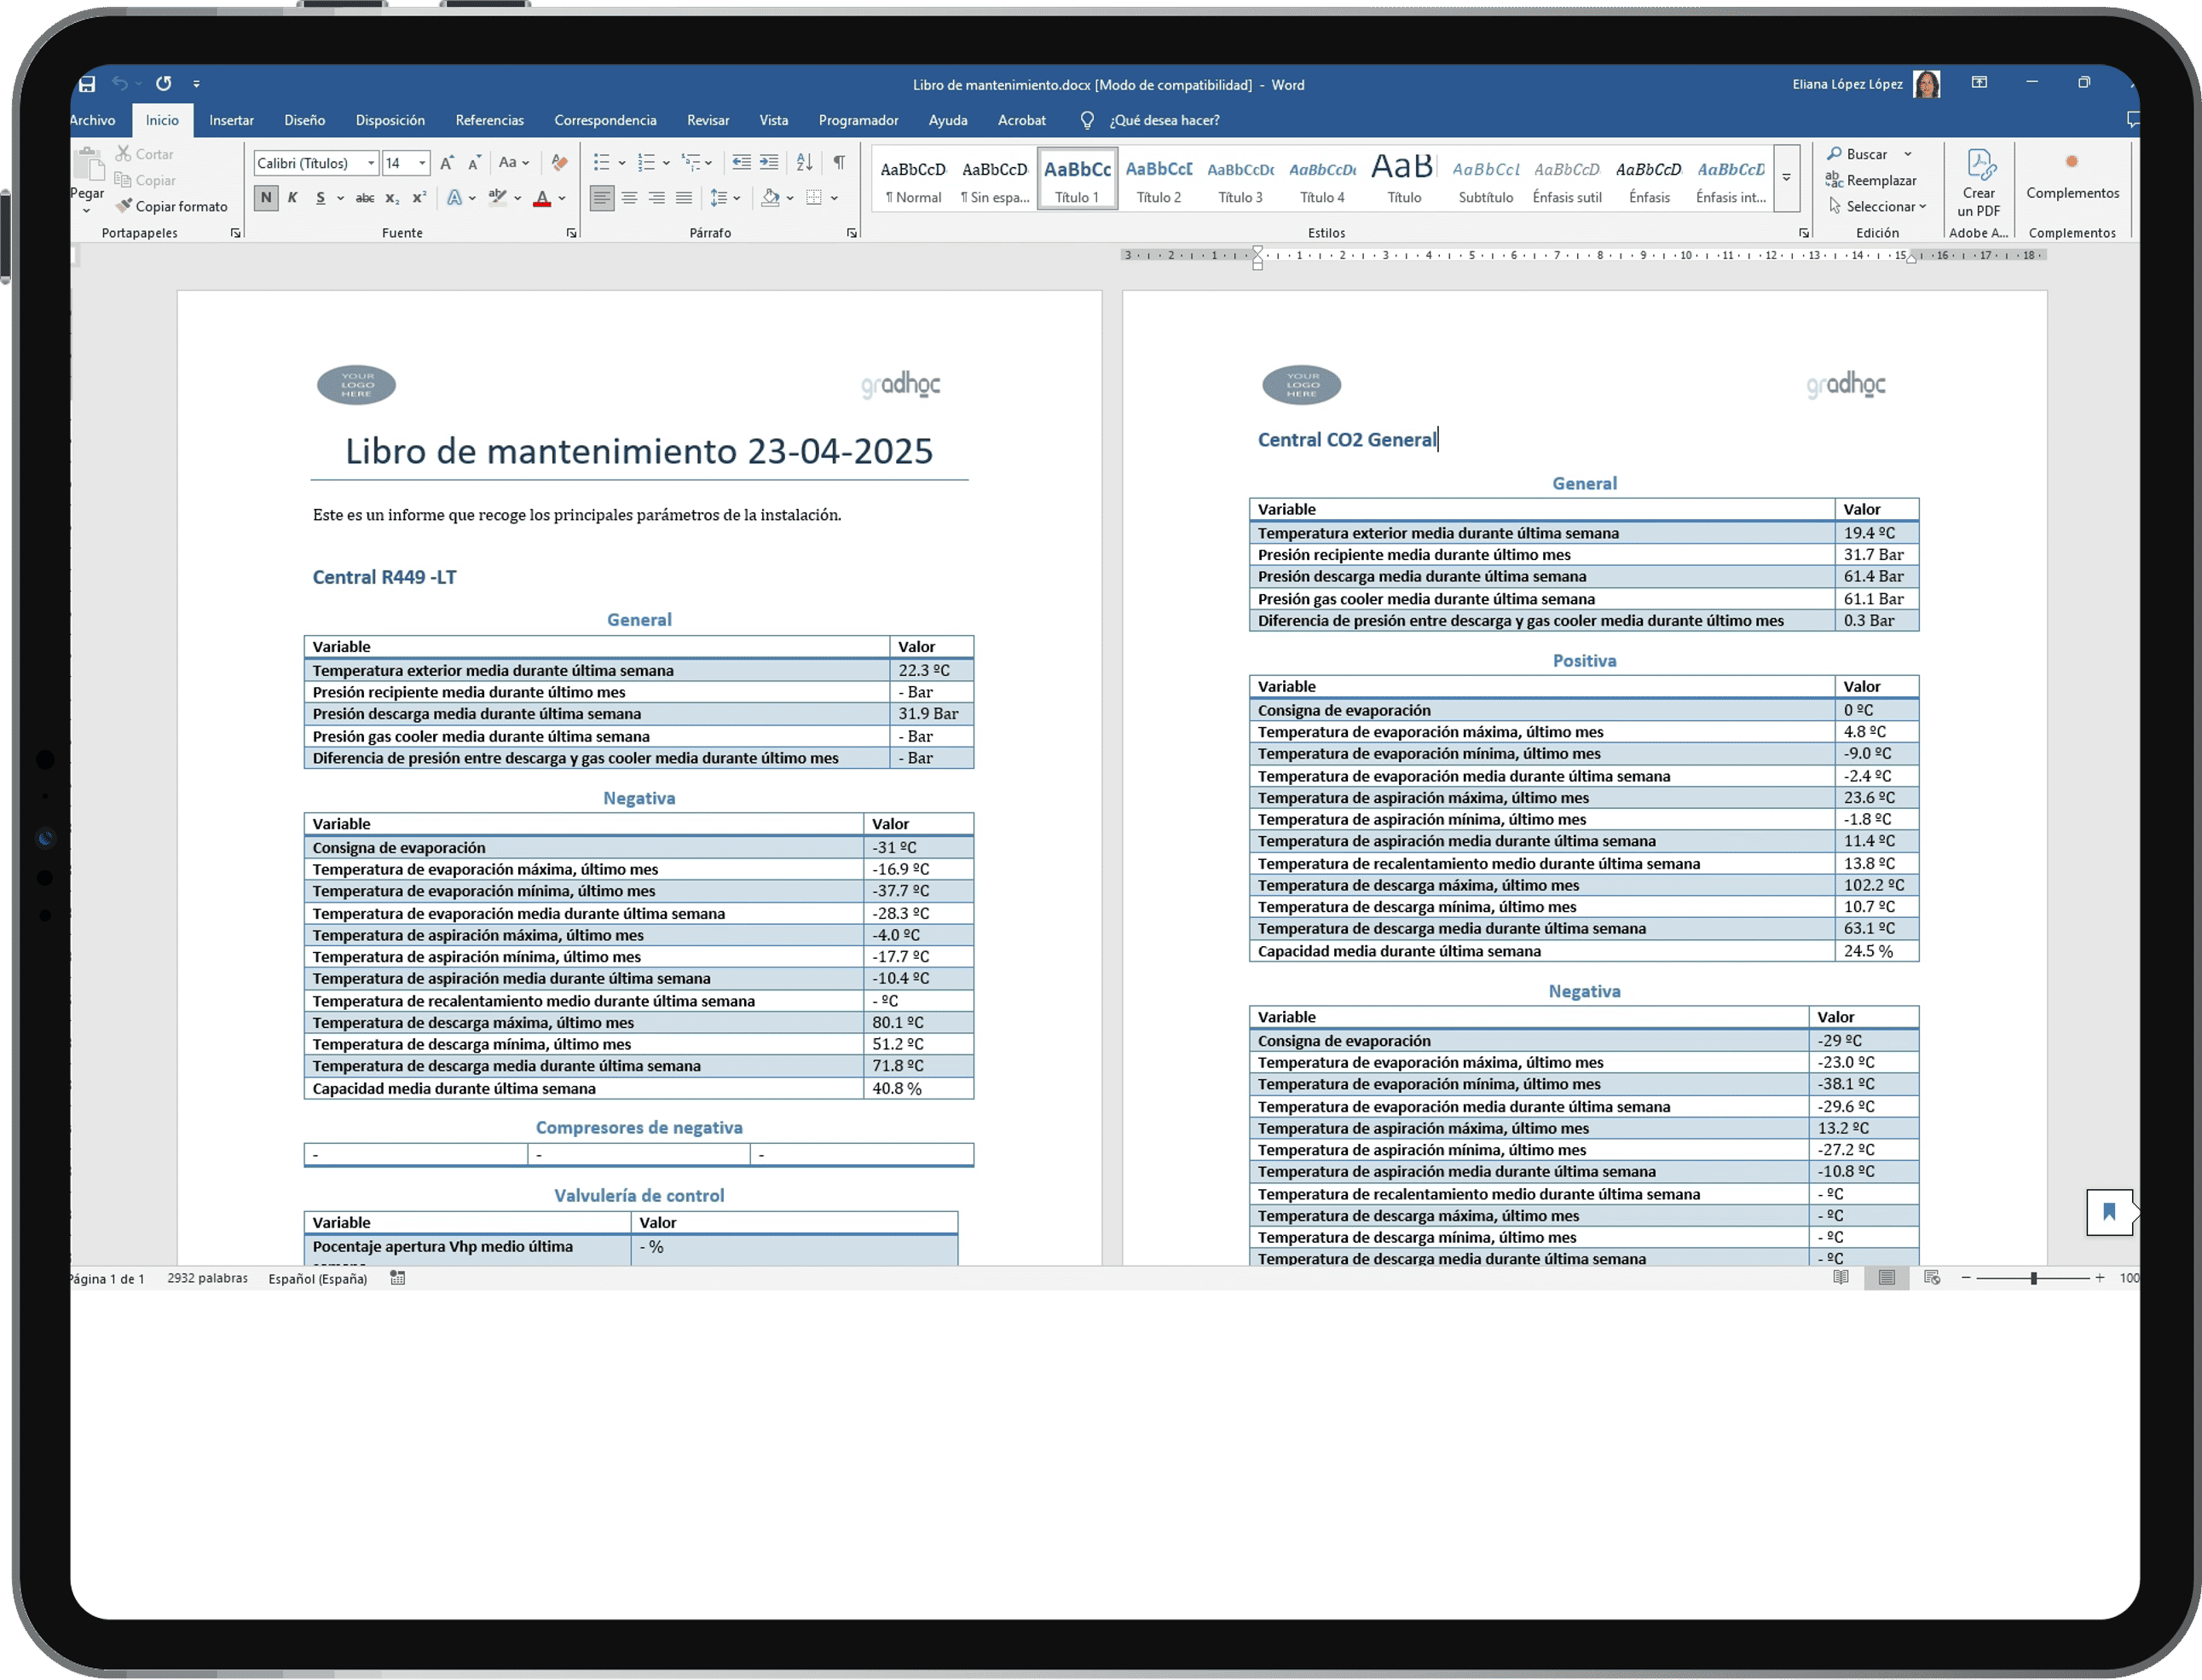
The reports are categorized as follows: Temperatures; Defrosting; Valves; Operation; Consumption and General. For instance, detailed reports on energy consumption, COP (Coefficient of Performance), defrost maps, process temperatures and more.